


Statistics
Last Updated: 17 February, 2023
Data at: February 16, 2023
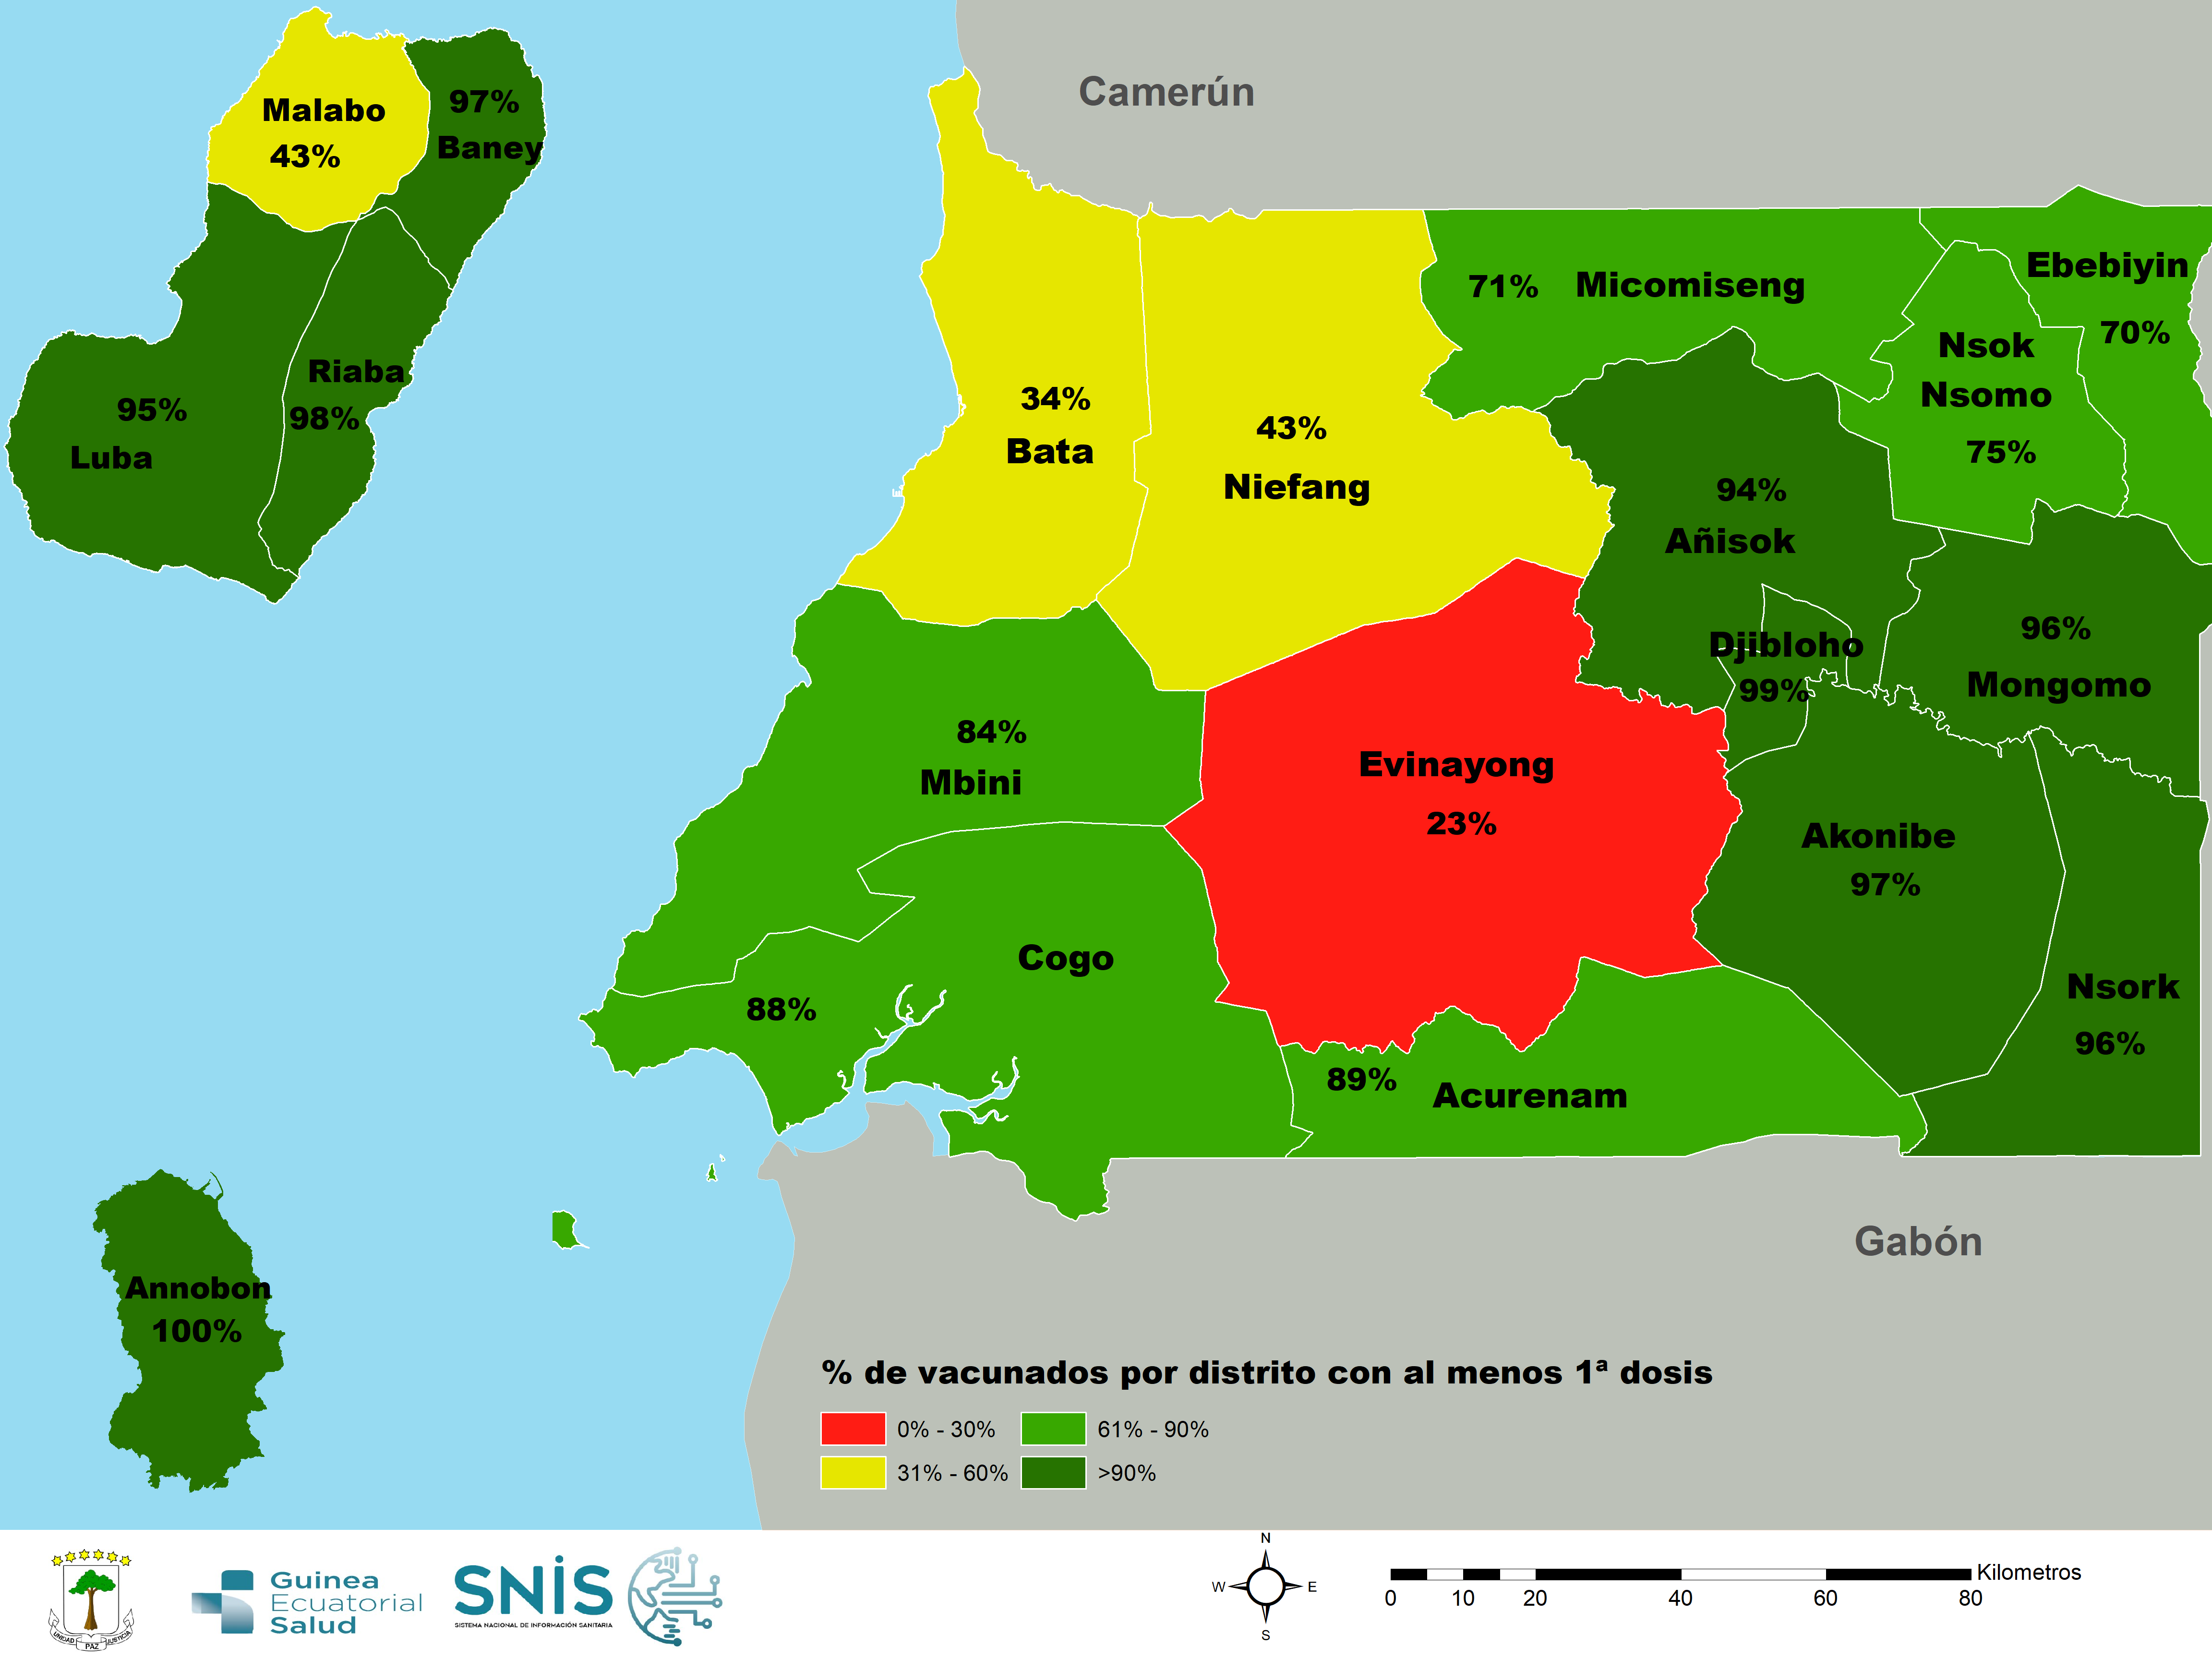
Vaccination map
Key points in the evolution of vaccination
| News (Last 7 days) | Totals | |
|---|---|---|
| Total Vaccinated 1st dose | 270.109 | |
| Total Vaccinated 2nd dose | 214.032 | |
| Total Vaccinated 3rd dose | 4.597 | |
| > 15 Contacts per day | 270.109 | |
| With Cormobilities | 8.828 | |
| Health Personnel | 9.105 | |
| Military Corps | 12.873 | |
| Other Professionals | 248.132 |
|
| Total doses administered | 488.738 |
Evolution of vaccinated per vaccination points

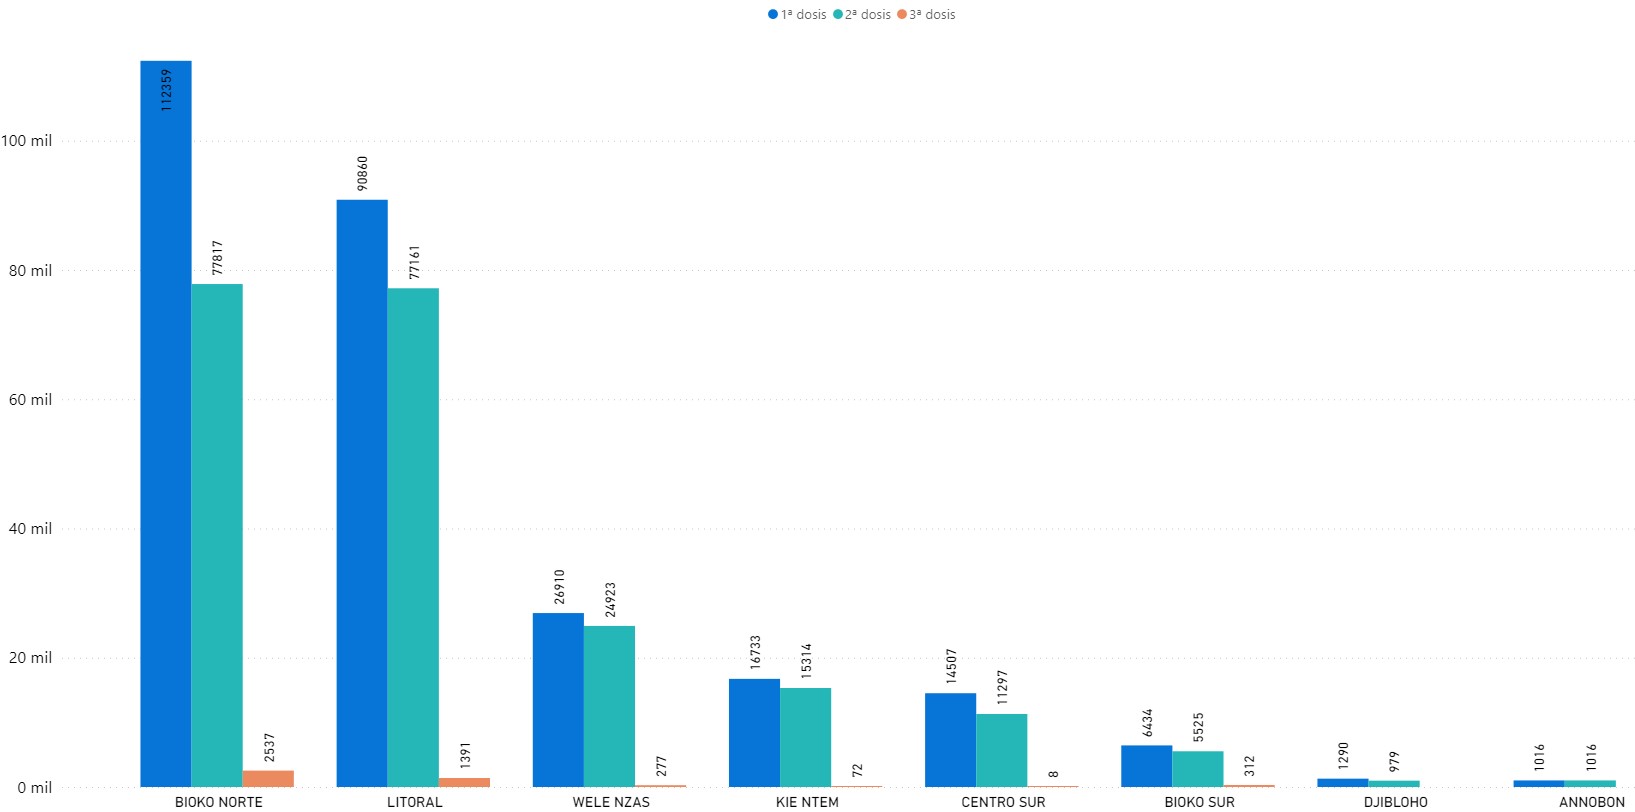
Vaccinated by region

Representation of vaccinated by province
Note: After cleaning the data, the following distribution of vaccinated by district is found:
The district of Malabo accumulates the highest percentage of vaccinated (35.86% with the 1st dose, 30.96% with the 2nd dose and 50.59% who have already received the 3rd dose), followed by Bata (30.49% with 1st dose, 32.72% with the 2nd dose and 29.82% who have already received the 3rd dose) and Baney is the third district with the most vaccinated (5.73% with the 1st dose, 5.39% with the 2nd dose and only 4.59% who already received the 3rd dose).
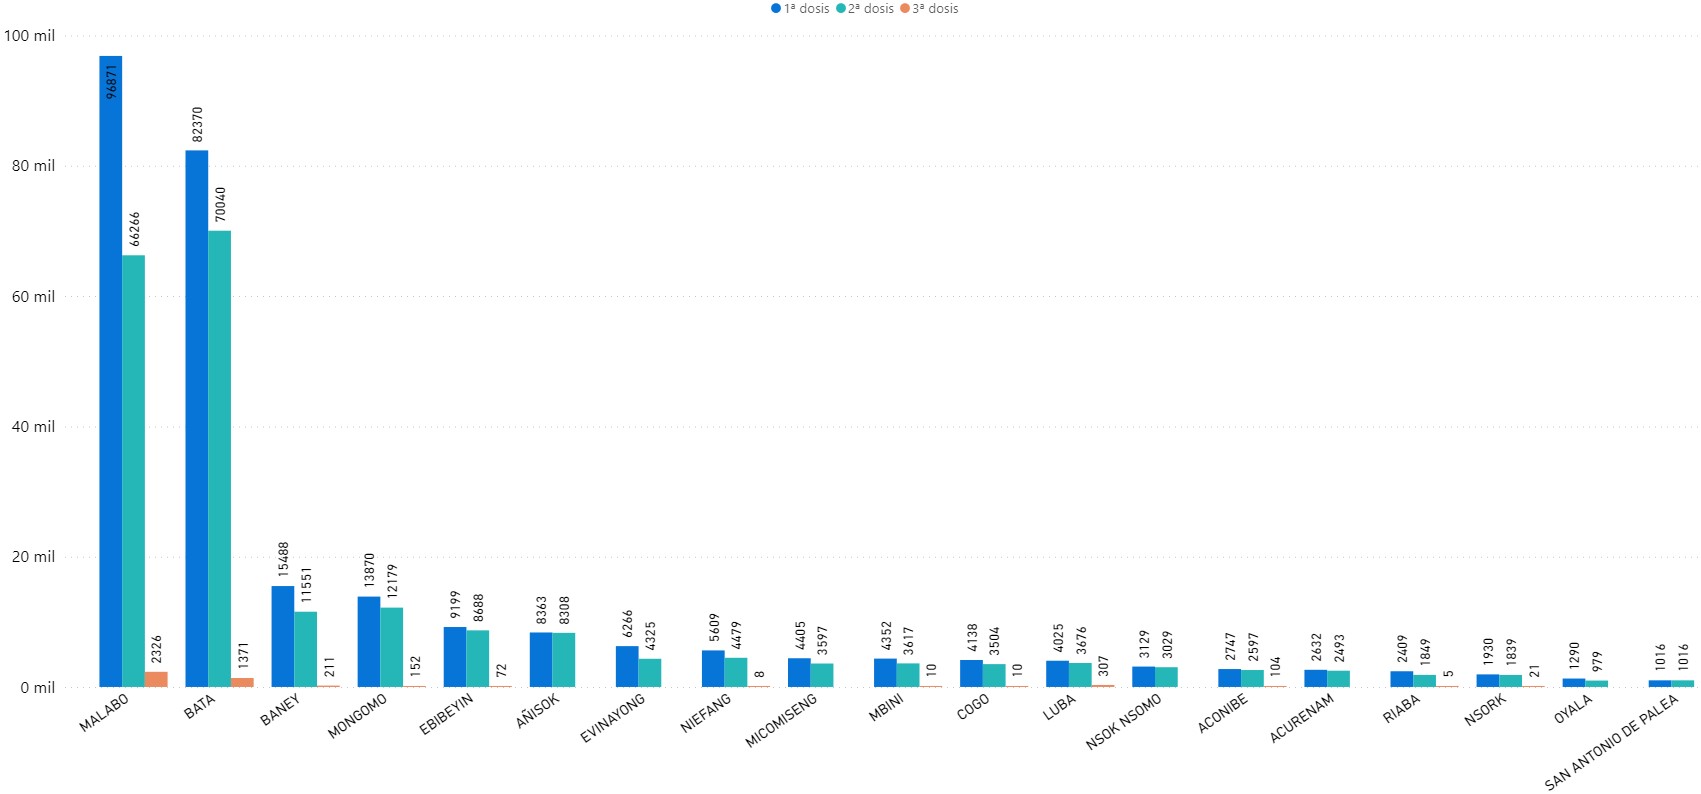
Representation of vaccinated by district
Vaccine Dose Distributed vs Vaccine Dose Administered

Distribution of vaccinated by profession

The distribution of those vaccinated according to professional groups is as follows: 91.86% of those vaccinated are from different professions not related to health or the military. The military group represents 4.77% of the total vaccinated and the health professional group represents 3.37%
Vaccinated by sex

Total vaccinated vs vaccinated with the 2nd dose

Of the 270,109 people vaccinated with at least one dose, some 209,435 (77.54%) have already received the second dose (complete schedule) and some 4,597 (1.7%) have already received the booster dose.
Test
| New (last 7 days) | Accumulated | |
|---|---|---|
| Total Test | 587 | 405.262 |
| Initial confirmation test (No control or registrations) | 587 | 400.887 |
Epidemilogy
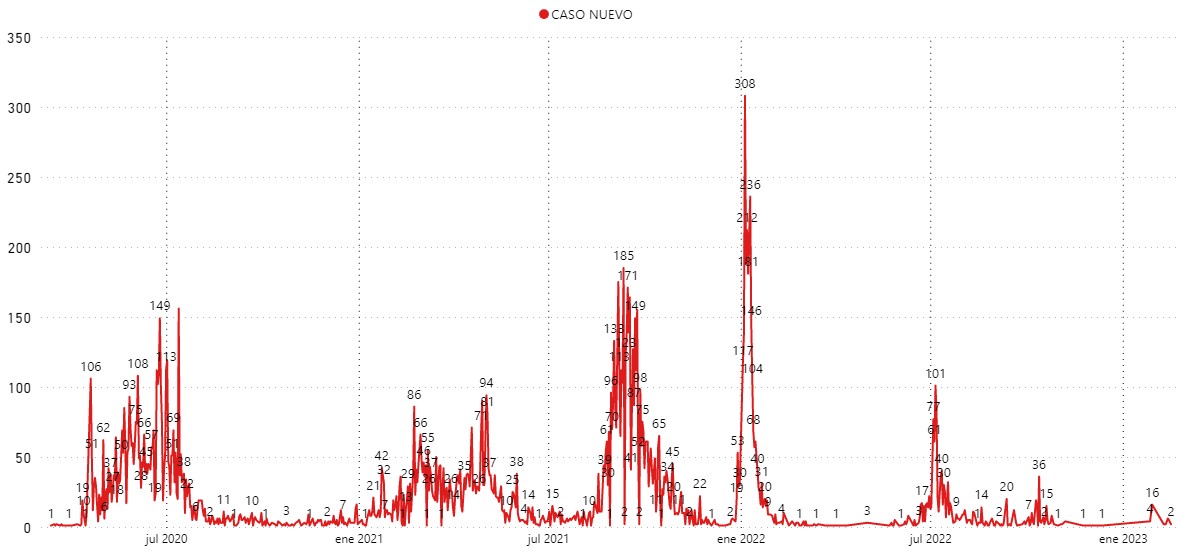
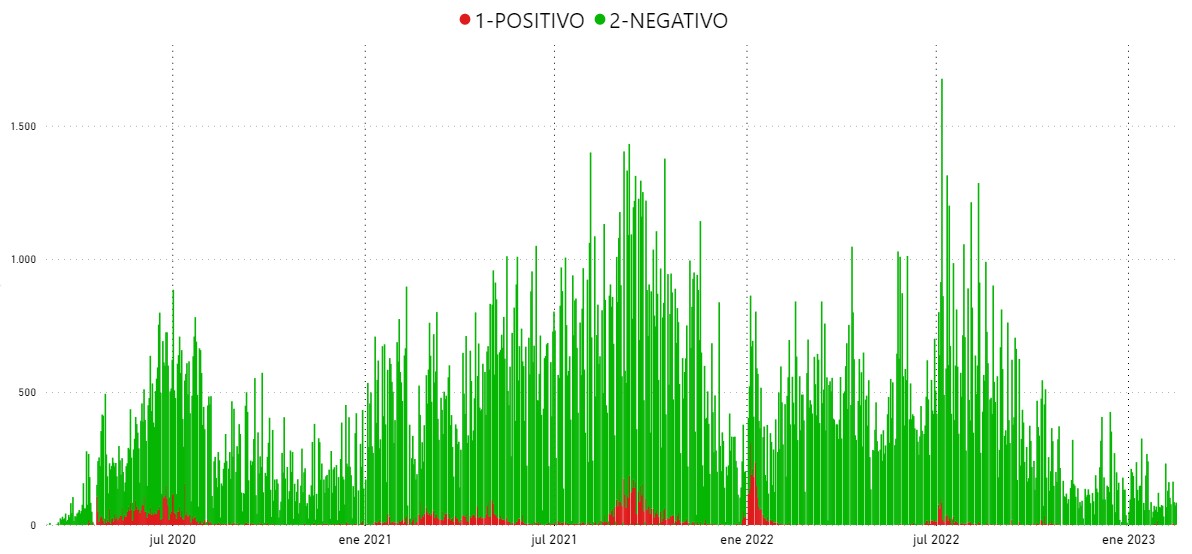
Epidemiological Curve of Confirmed Cases per day
Epidemiological curve of tests and results
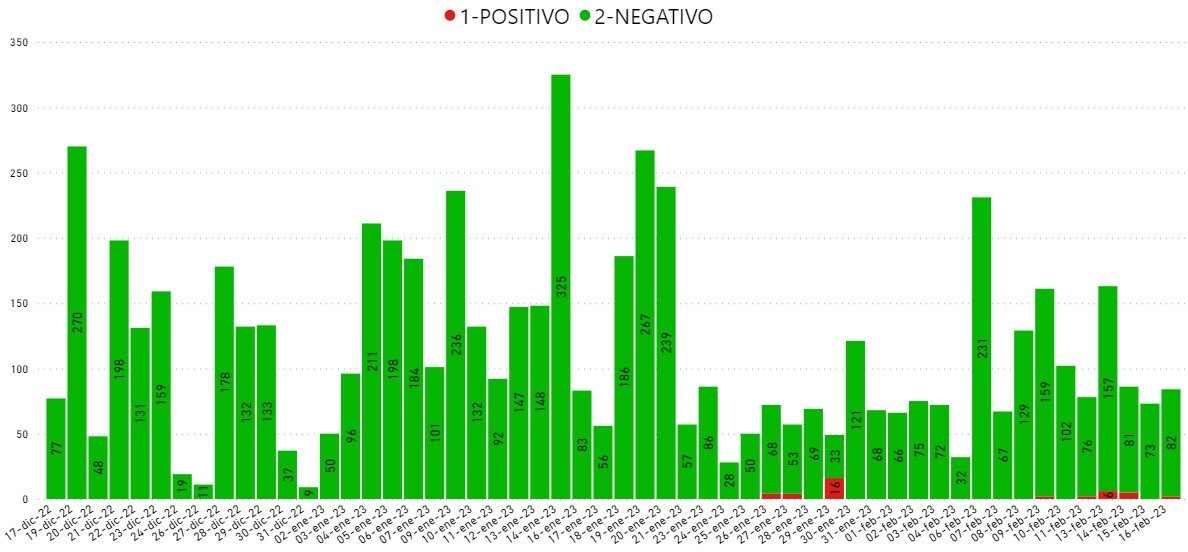
Comparison of Tests performed vs Results (17 December – 16 February)
Proportion of positive cases per week (positivity rate)

This graph shows an increase in the weekly positivity rate in proportion to new cases, going from 0.52% (week of February 05 to 11, 2023) to 3.19% week of (February 12 to 18, 2023).
Hospitalizations per day

This graph shows a decrease in new hospitalized cases (last hospitalizations of Covid-19 cases took place on October 20, 2022) due to symptoms.
Confirmed cases by districts

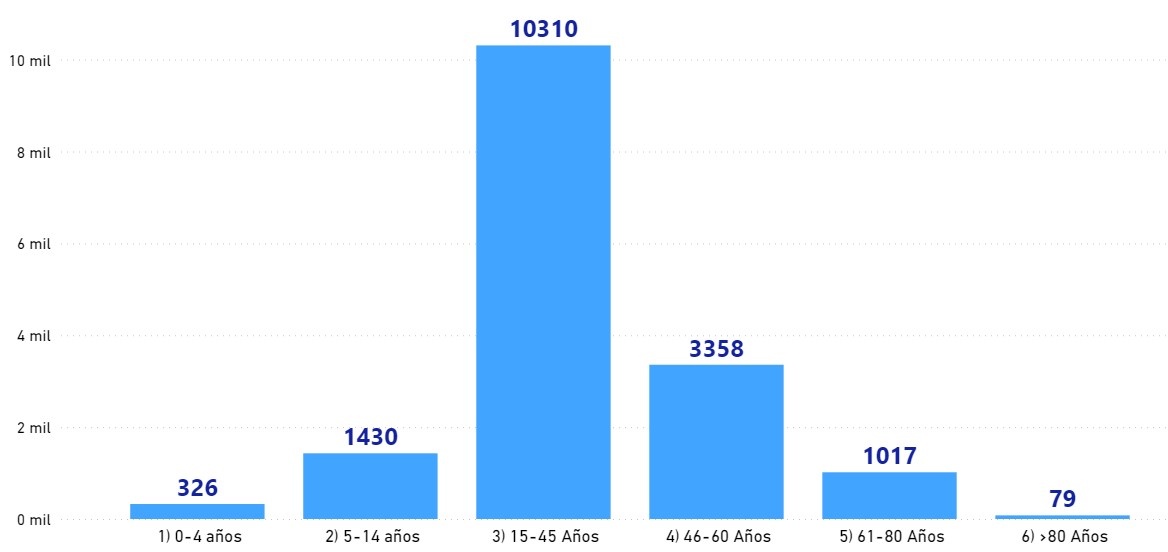
Confirmed cases by age and gender
Confirmed Cases by Region

| New (last 7 days) | Accumulated | ||
|---|---|---|---|
|
Confirmed Cases |
15 |
17130 |
|
|
Imported |
1549 | ||
|
Local |
15581 | ||
| Male | 57,28% | ||
| Female | 42,72% | ||
|
Most affected age group |
15-45 (60,19%) | ||
| Insular Region | 77,23% | ||
| Continental Region | 22,77% | ||
|
Percentage of asymptomatic cases |
92,54% | ||
| Positive health professionals | 0 | 635 | |
| Health professionals deceased | 6 | ||
| Positivity rate | 2.6 | 4.3 | |
|
Recovered |
20 |
16907 |
|
|
Deaths |
183 |
||
|
Fatality rate |
1,07 | ||
|
Active cases |
17 |
Active case management
| Hospitalized cases | 0 |
|---|---|
| Mild or moderate cases | 0 |
| Serious cases | 0 |
| Critical cases | 0 |
Contacts
| No. of direct contacts Accumulated | 46126 | |
| No. active contacts | 1000 | |
| Percentage of contacts in follow-up (last 24 h) |
0% |
La situación actual de la pandemia del Covid-19, en relación al periodo comprendido entre el 3 de marzo y el 15 de junio 2020, se presenta de la siguiente manera
Test realizados
Casos confirmados
* Notes: in order to always offer refined data, the updating of the information and the constant cleaning of the data is being carried out